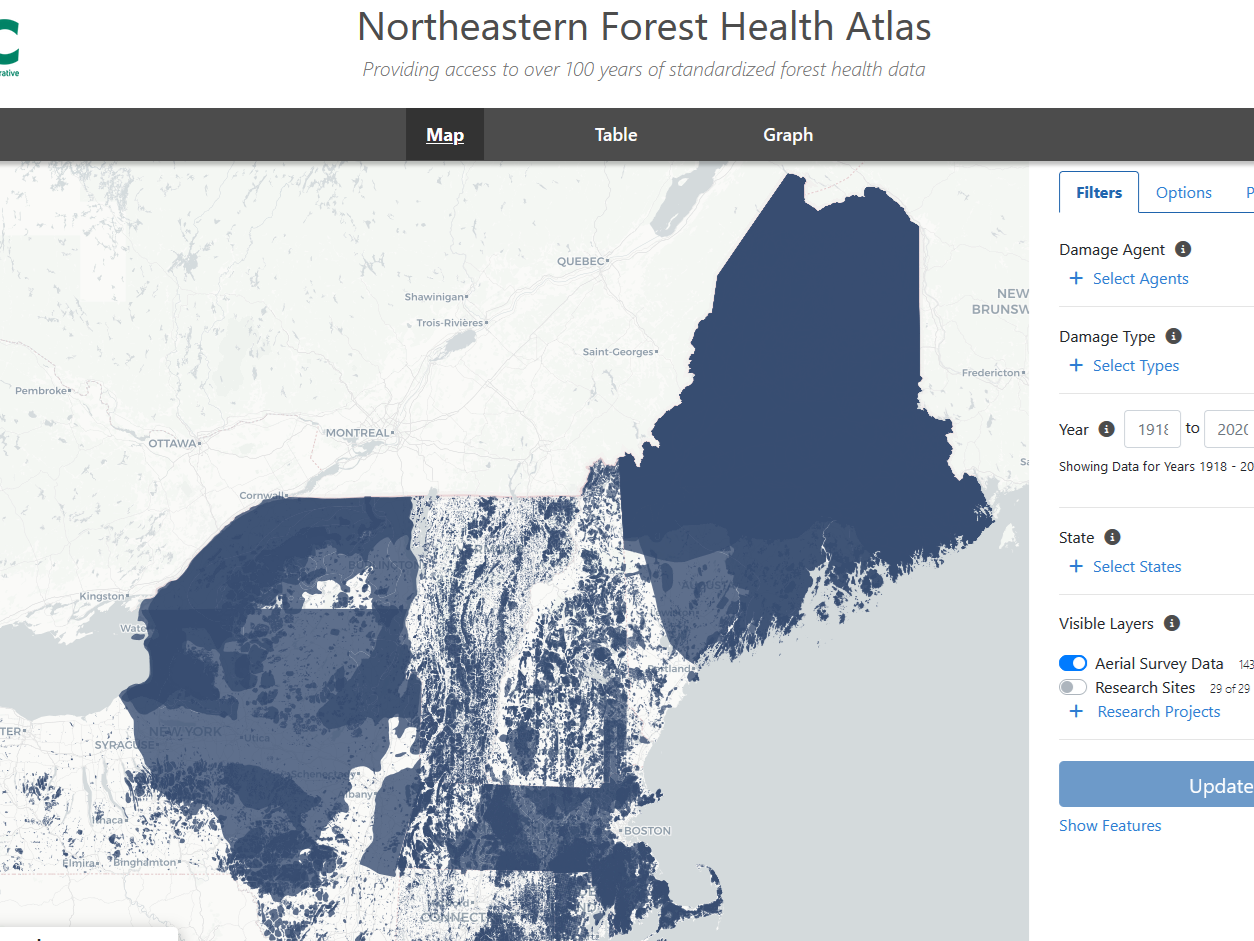
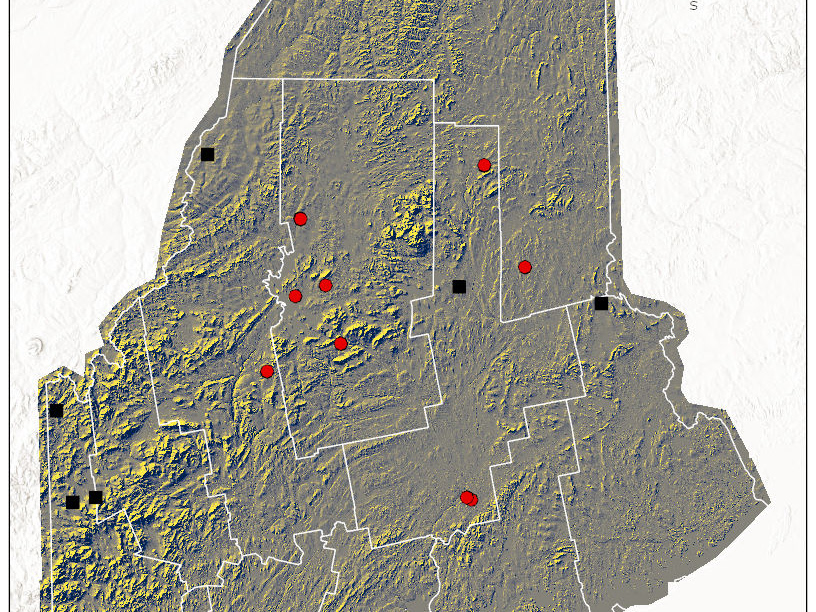
Overview:
Dashboards are powerful data visualization tool that allows for interactive learning and presenting. I have worked with multiple dashboards using both R shiny in R and Dash in Python.
These platforms allow for quick and easy generation of interactive and fun data interfaces that are web hosted and locally run. Below I will share some of the multi-functionality and user-driven experiences you can provide to better get across your data.



Example Dashboard using R Shiny:
This dashboard displays some of the useful multifunctionality and interactive visualization capabilities. Such as Zooming features for geospatial layer interaction
Subsetting visualized data via check-boxes
Selecting specific layers from dropdown menus
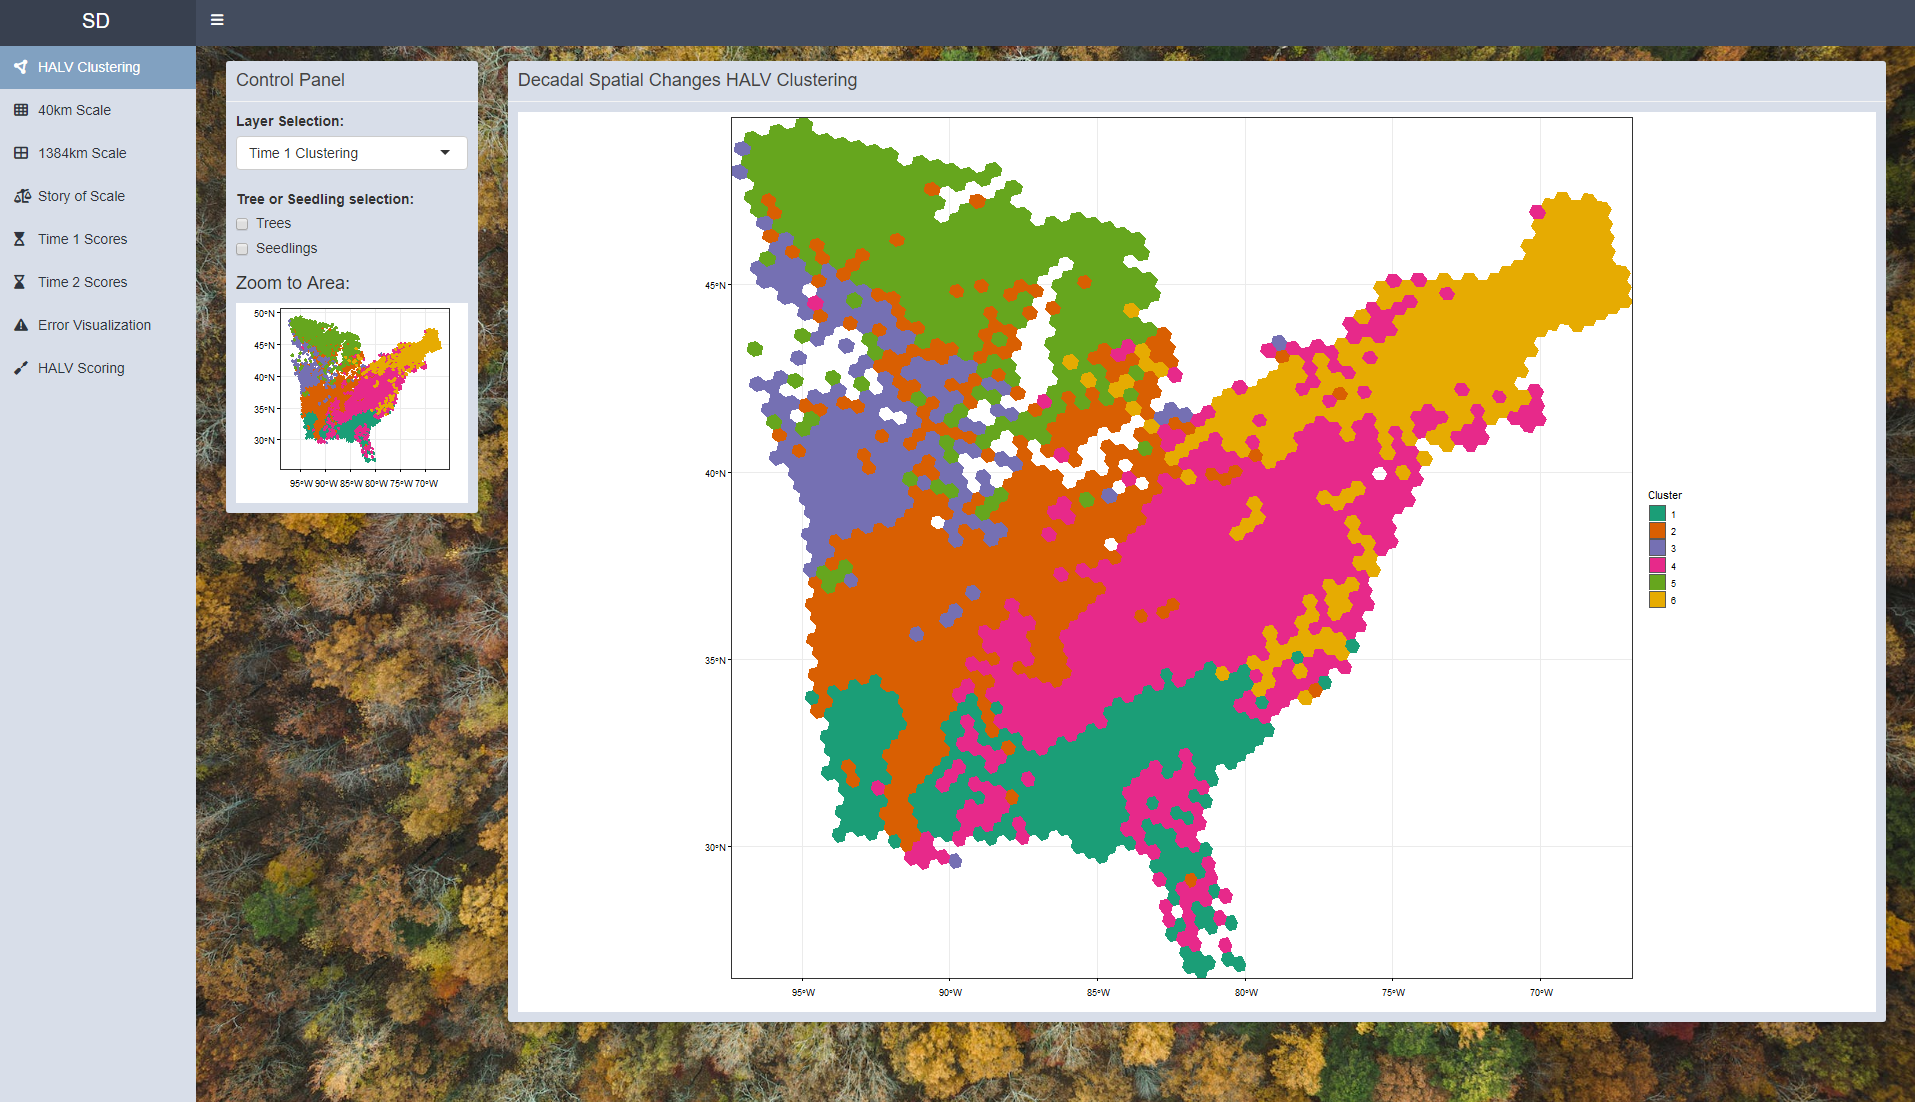
This Web Application is currently under development and has not fully been deployed.

